10.06.2020

Ever since Voyager 2 revealed Saturn’s unique hexagon-shaped clouds at its north pole, the feature has been a puzzle, and the search for a combination of factors responsible has included computer modeling as well as physical modeling with things like rotating tanks of fluid.
Most ideas have centered around (pun intended) a phenomenon known as “Rossby waves.” The meanders of Earth’s jet streams are a familiar example of this phenomenon. And, in various experiments, researchers have gotten Rossby waves to stabilize in a hexagonal pattern in conditions meant to relate to Saturn’s pole.
But Harvard’s Rakesh Yadav and Jeremy Bloxham felt these studies were a little shallow—not in a pejorative sense, but literally. On Earth, it’s easy enough to decide how to size an atmospheric model, because it’s very clear that it stops at the surface. For Saturn, it’s a little more debatable how thick you need to make your model to represent the behavior of the giant planet’s outer atmosphere. The researchers wanted their simulation to extend deeper to see what kind of impact convection from below would have.
The model simulates a shell spanning the outermost 10 percent of Saturn’s radius. It’s pretty computationally intensive to run, so Yadav and Bloxham weren’t able to twiddle the knobs too much. We have limited data about anything but the uppermost layers of Saturn’s atmosphere, and there are lots of physical properties that could be tweaked in search of a perfect match. But for now, this study presents one possible configuration of the model, described as a “proof of concept.”
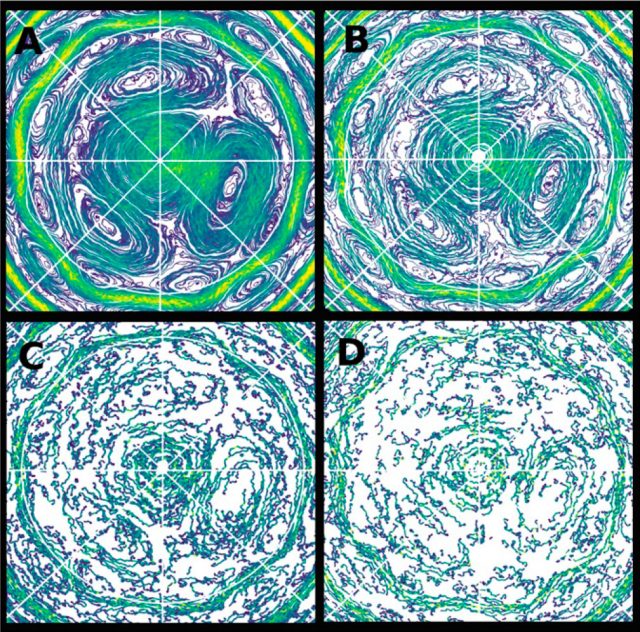
Still, the general pattern of atmospheric circulation looks quite realistic. There are alternating bands of eastward and westward winds in the right places, including strong jet streams. Between these jets, the model produces some vortices—particularly as you get closer to the poles. That seems to be a result of the equatorial bands changing from a ring-like shape at the equator to something closer and closer to a flat disk at the pole. These vortices have the effect of putting a kink in the wind band, giving it a more angular or polygonal shape.
But the behavior of these vortices near the pole is where this model gets interesting. The vertical overturning of the atmosphere with convection has a peculiar effect as gas gets much less dense near the top. The upward momentum is constant, but because the gas becomes less dense, the velocity increases as it goes.
This makes the motion at the top of the vortex more turbulent, causing it to lose its coherent organization. So at the very top—which is what we see when looking at Saturn—the turbulence masks the vortex underneath.

So in this model, a persistent set of vortices surrounding the polar jet stream squeezes it into a polygonal shape, which could help explain how the real Saturn’s polar hexagon has kept its tidy shape for as long as we’ve been watching.
The model certainly isn’t perfect, though. The simulated polar jet appears triangular rather than hexagonal, for one thing. The gradual westward rotation of that shape was also faster than what we’ve observed on Saturn. And while the model does produce a different circulation pattern in Saturn’s southern hemisphere—which is less well studied but lacks the hexagon seen at the northern pole—the paper barely touches on how well the simulation compares to reality.
Working from this “proof of concept,” the researchers say that much more time spent testing out different configurations of the model may uncover an even more accurate picture. But their larger point is that they think they might have the right process to explain Saturn’s marvelous polar storms.
Quelle: arsTechnica
